
This is the second part of this article about how to write an academic paper including AFM data. If you have not already, you should read the first part here.
NOTE: Some of this content is not really specific to AFM articles, but could be applied to any experimental scientific report. These parts should already be known to you if you are writing an scientific article, but many researchers are never taught how to correctly prepare a scientific article before they start writing them. For more general guides on preparing scientific articles, check here.
Figure legend. The figure legend is an important part of the figure. It should not be too brief, e.g. “Figure 1. AFM images of samples 1 and 2.”. But it should also not be too long. It should be concise, but has to have all the information needed to enable the reader to understand the figure. It should have a description of the type of data, if necessary explain the scale of the images, and clearly identify the samples shown. For example, a good figure legend might be: “Figure 1. Representative tapping mode AFM images of samples 1 and 2. A: Height image of sample 1; B: Phase image of sample 1; C: Height image of sample 2; D: Phase image of sample 2. All images show 1????m x 1????m areas, and the z scales are indicated next to the height images. The arrows show the location of anomalous nanoparticles discussed in the text.”
-
Reproducibility
All numeric values included in the results must be accompanied by standard errors, or standard deviation of the means. You must also say how many measurements were made. It is important to discuss how many areas were imaged, and how often the features discussed in the text occurred. It’s not acceptable to show only one image, with the assumption that it represents a whole sample!
-
Conclusions
It should go without saying that the conlcusions you make based on your AFM data must be justified. This often means that you should calculate the occurrence of specific features, so if you want to say that the surface got rougher, or features grew after treatment, you should measure this, and show means, and errors, or a histogram of results. Note that histograms can help a lot with non standard data distributions, i.e. where there are outliers.
Can lateral measurements be used in AFM? Yes - but with caution, and only sometimes. If you have samples that are small, comparable to an AFM probe tip, lateral measurements of them will be wildly erroneous with AFM. For this reason it’s nearly always preferable to use vertical measurements where possible. Lateral measurements typically only work well for features much larger than the AFM probe, so you must be careful with these. One way to reduce the effect of these errors is to deconvolve the probe shape from your images. See section 2.3.4 of Atomic Force Microscopy.
If your conclusions are based on certain small features in your images, you can present your images in a way so as to make these features clear. This can be done by:
-
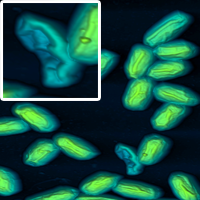
Cropping. A nice way to highlight certain features is to show a large image as well as a cropped section magnifying the feature you wish to show.
-
Histogram control. Control the height range shown in your height images to highlight the part you are interested in showing. So for example, if you wish to show tiny 20 nm features, you cannot do it with a z-scale of microns in a height image.
-
Shading. Light shading is a routine available in all AFM processing packages (such as SPIP and Gwyddion), which can highlight small topographic differences
-
Including error signals or phase images. These channels are frequently better for showing small details.
-
Highlighting with arrows. As discussed above.
-
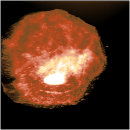
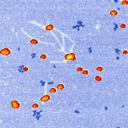
Using unusual colour schemes. In general complex colour schemes make for confusing images, but for some images they can be appropriate, and help to illustrate the different features at different heights.
Some examples of these schemes are shown below.
Good luck with your AFM articles! If you have more questions, contact me here.
NB. All the images in these two articles were produced with SPIP 6.7.7 or Gwyddion 2.40
This article and all content is copyright Peter Eaton and AFMHelp.com 2019.